
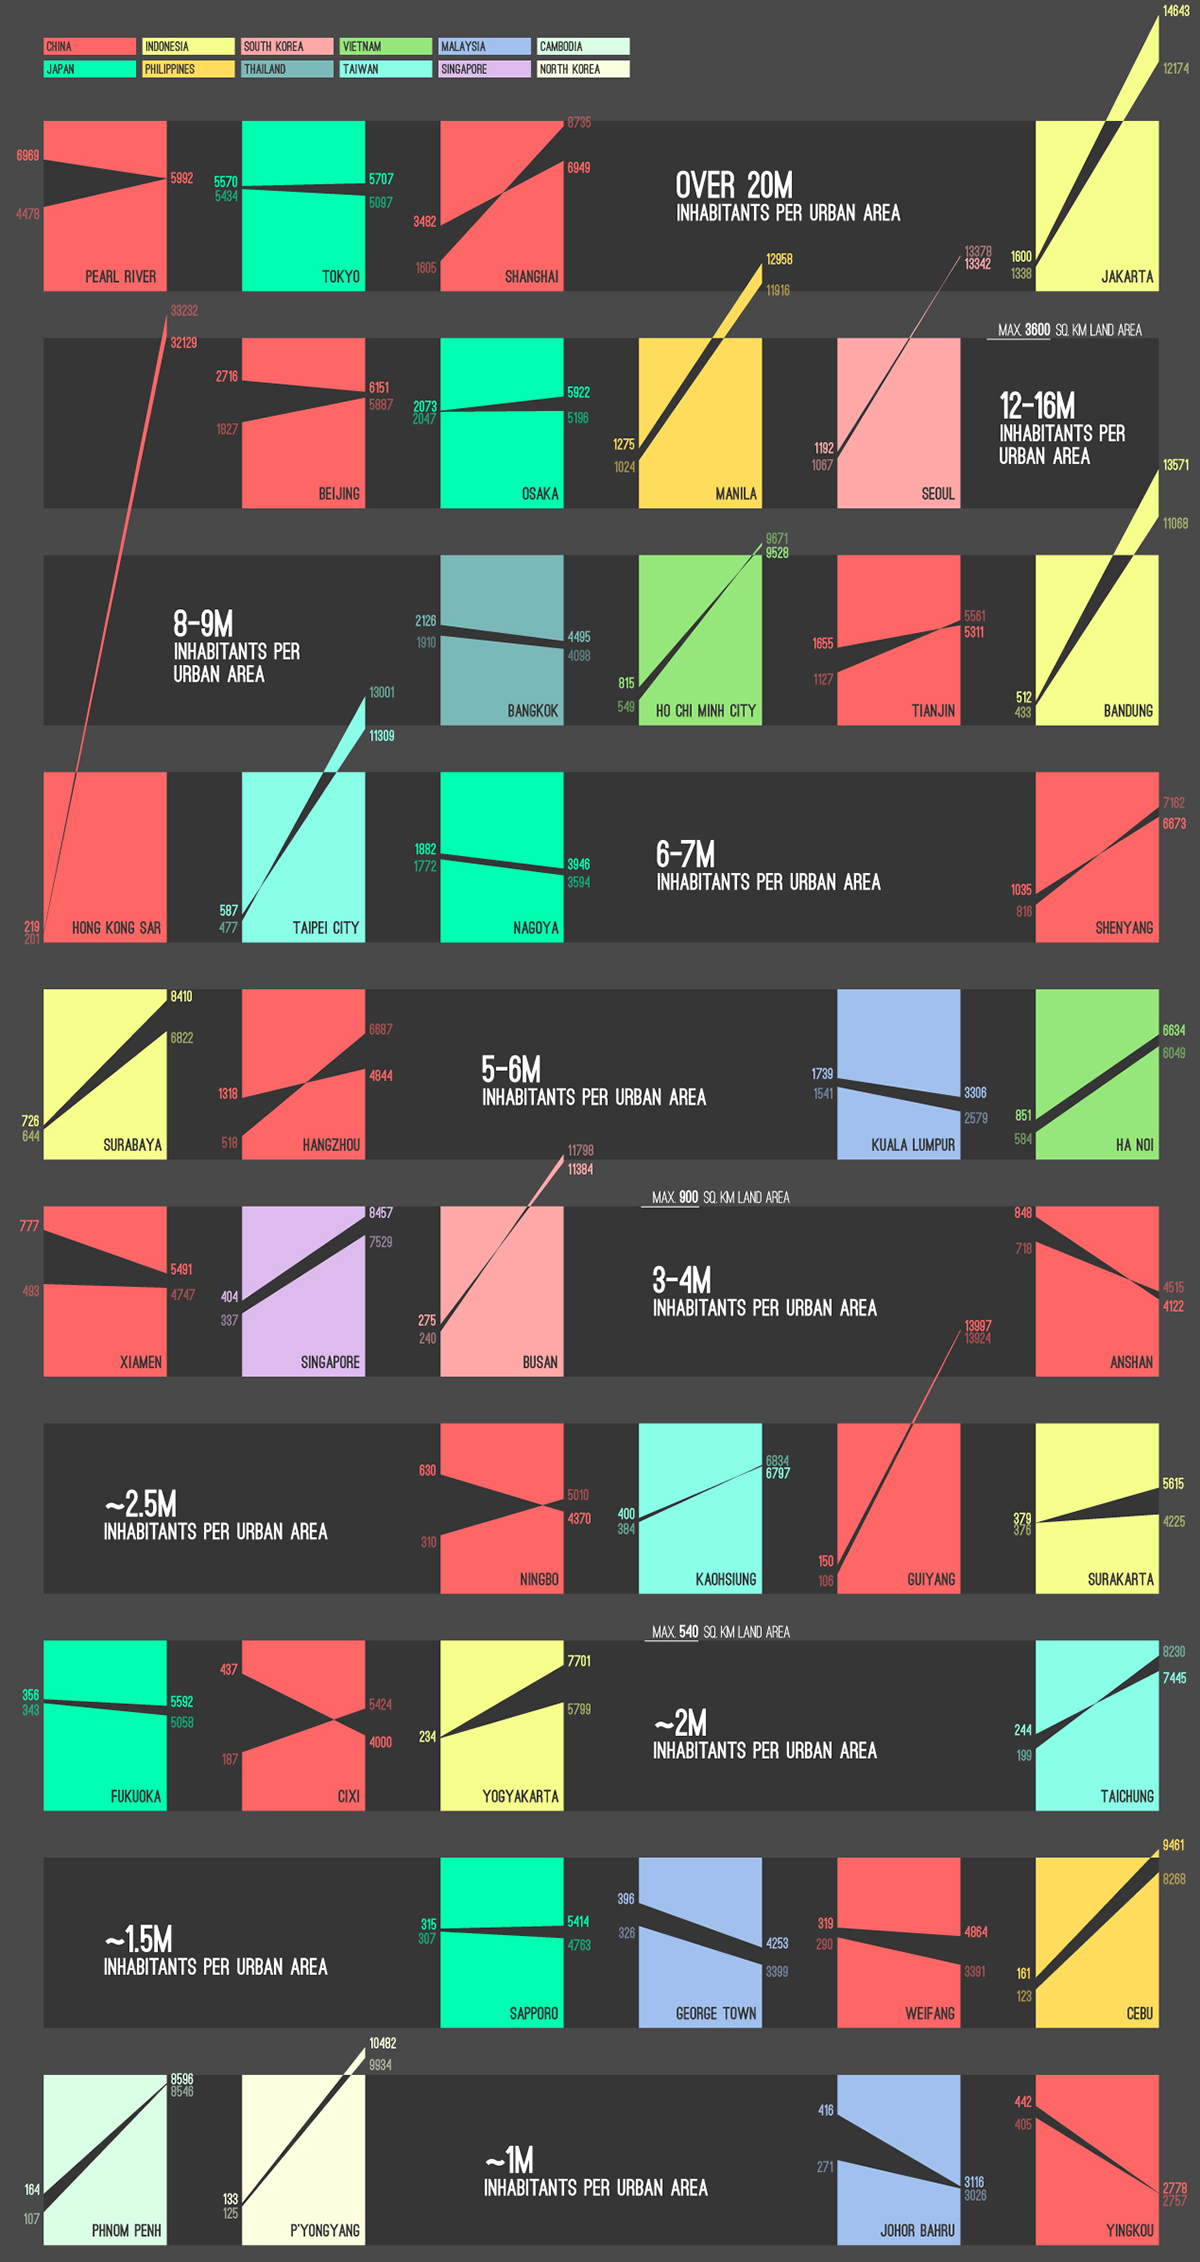
East Asia urbanization between 2000 and 2010
The visualization features 10 population brackets represented by 4 urban areas each.
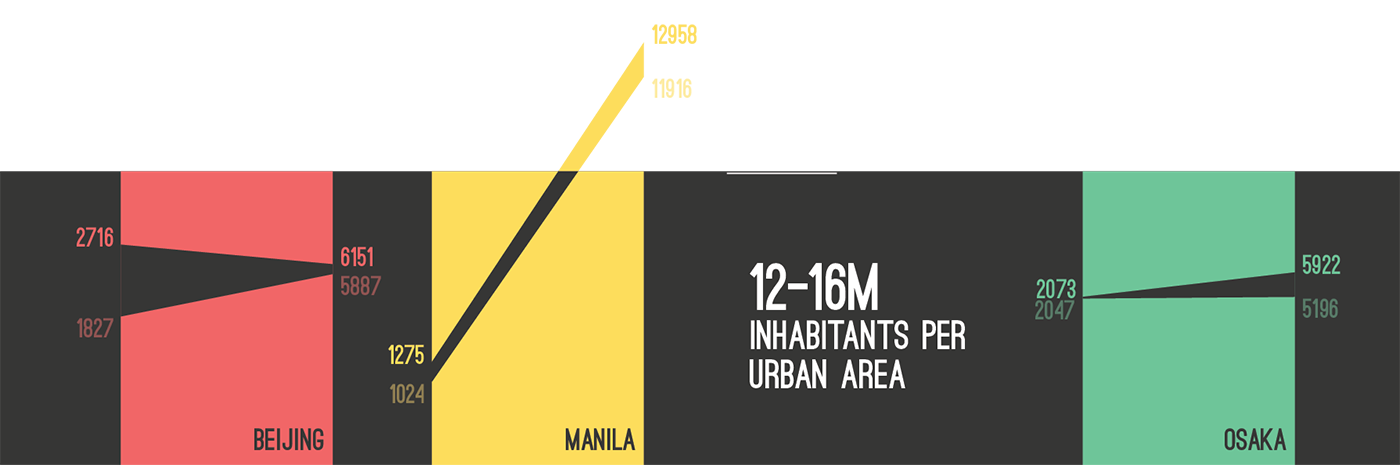
The visual key is the 'gap' which represents the expansion of land and growth in population density between 2000 and 2010.
The left-side of the gap shows the urban land expansion, the right-side shows the change of population density in urban areas.
Mind the steepness of the slope. The steeper it is, the higher the population density in that area.
data source: openknowledge.worldbank.org